In this section I’ll showcase some of the tools & techniques I like to use to analyze data
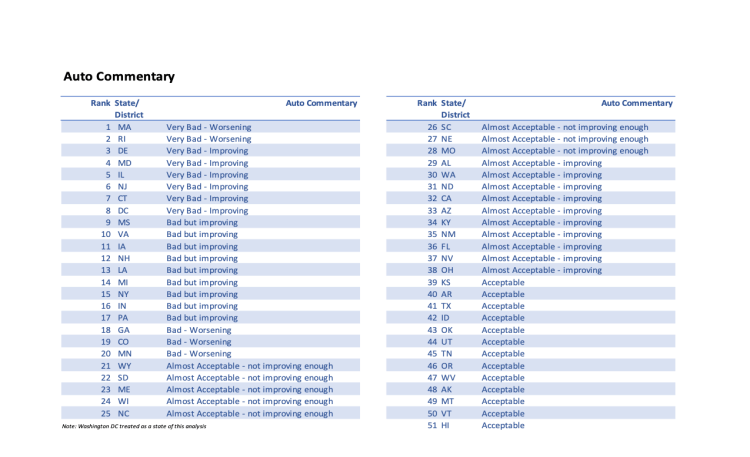
Excel Tables
Tables are the foundation of efficient analysis of large amounts of data in Excel. They empower you to easily add your own formulas. Plus I love adding ‘slicers’ to the data to help navigate. Bonus content will be added here.
Visual Basic – VBA
Visual Basic brings the power of a programming language to your own spreadsheets. Just as you can easily add new sheets, charts and tables, VBA can automate tasks for you. I like to call this ‘digital labor’. It will make you more efficient!

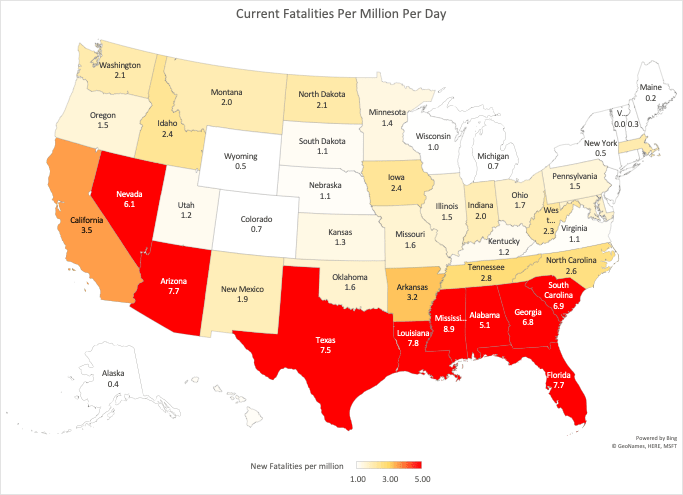
Excel Maps
It may surprise you to find that Excel is actually really, really good at generating maps. Take a look at some examples
Folium Maps
I recently learned about this from a Nashville Software school course. Folium maps generate interactive content that you can easily share with others. Check out some of my examples.

