
Assessing the impact on building permits
I recently completed a Nashville Software School jumpstart course on data analytics using Python. It was very cool. This example is the result of our learning. Our group project focused on the impact of the 2020 tornado
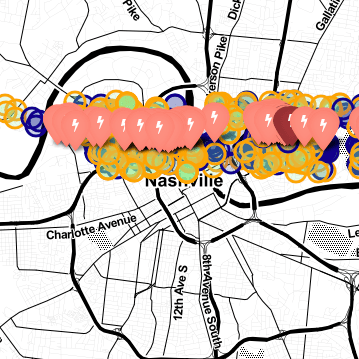
The Nashville 2020 Tornado was the 6th costliest in US history, with estimated damages of $2bn
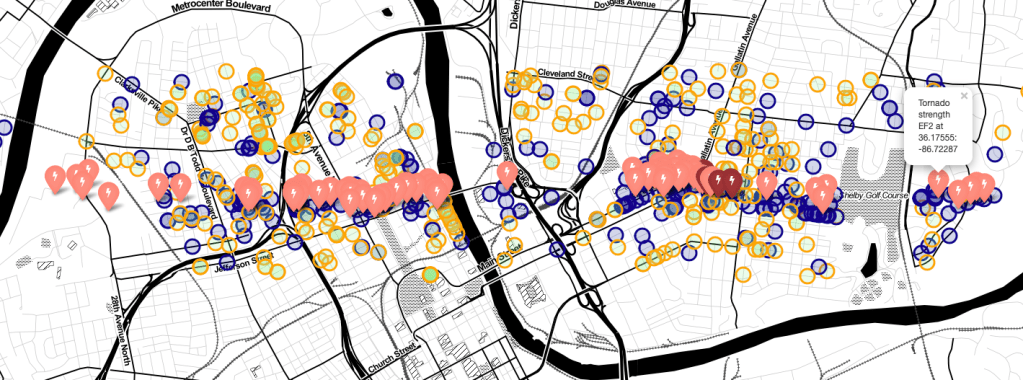
Mapping
Using Python and Folium Maps we were able to plot the path of the Tornao and the building permits in the area.
Folium maps is very powerful – and creates html files that can be shared with users that remain interactive.
Download the zip file below; unzip it and then double click (it should open in your browser)


221% increase in value of construction permits
This is a slide from our group analysis.
For the 3 months – March to May in 2020, the value of permit applications increased by almost $85 million.

Decline outside the Tornado Zone
At the time of this analysis (mid August 2020), the construction permit costs were down about 12% on a run rate basis from 2019.

A possible factor in this decline is the COVID-19 Pandemic.
