I recently learned about an excel feature called StockHistory. It has transformed my analysis, and in doing so, reminded me of the importance of long term thinking.
Market risk can be a scary business – especially when considering your own investments. Are we being objective in our decisions? Sometimes its better not to track market moves on a daily or weekly basis. Here’s a quote to illustrate this from Charlie Munger (Berkshire Hathaway)
“For the great majority of people, who don’t have the time or the inclination to study investments, I think the S&P 500 index fund is the way to go. It’s a very low-cost way to get a diversified portfolio of America’s best companies.”Charlie Munger
Lets break that down with some S&P data. Side plug here – check out Excel’s great capabilities with the StockHistory function. I have been using this for several weeks now and it is a GAME CHANGER for my own personal analysis. Separate post to come on this.
Lets look at the distribution of monthly returns in the S&P
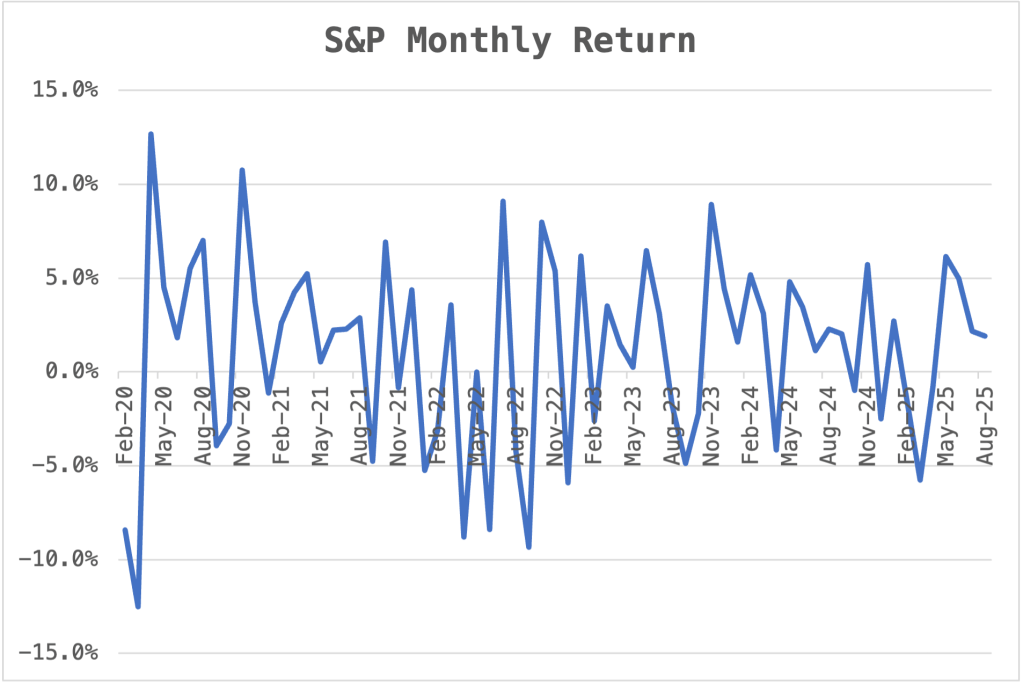
On the surface, that’s quite a bumpy ride. It shows that trying to time the market is difficult – and something that’s best left to the professionals.
Another way to look at those numbers is to look at them in buckets. Of the 68 periods between Jan 2020 and August 2025 there were 8 that were strongly negative (more than 5% loss), and 16 that were slightly negative (between 0 and -5%). That’s a total of 24 down months, compared to 43 up months.

This might make you feel better about Charlie Munger’s recommendation. However, lets look more closely at the question of timing.
Here’s where automating investments (like 401k) makes a lot of sense
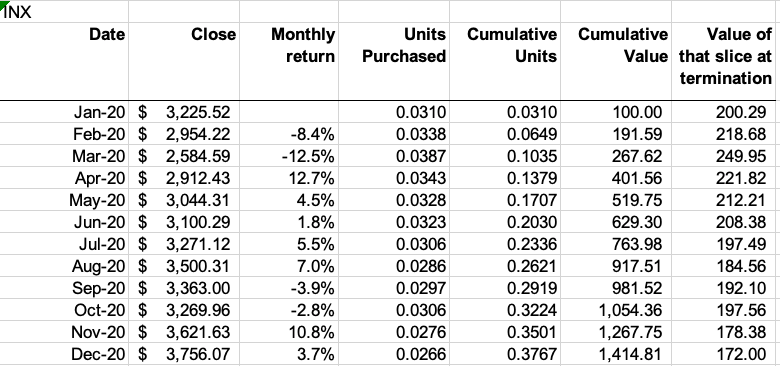
The problem is no-one can predict the next market move – it could be up or down. So lets think about automating the investment decision. What would happen if you invested $100 per month every month?
Short answer: After 68 periods you would have invested $6,800. The value of all those investments today would be $10,251. That’s a return of 51% over and above your principal.
Here’s how it works: $100 invested at the end of Jan 2020 – would be worth $200 today. That slice of your investment has been in the market for 67 periods. $100 invested at the end of February would be worth $218 today. Alhough that investment has been in the market for only 66 periods, the February investment bought more shares because the market fell in Jan, Feb, and March 2020. Here’ a sample of the analysis.
The term for this is dollar cost averaging. Although it sounds like a highfalutin phrase an economics professor might use, its important we all understand how practical and valuable this is for us.
Young people may be dissuaded to invested as a result of market volatility, or people may be tempted to exit investment holdings when markets turn south. But think again of the wisdom of the Charlie Munger quote. Periodically investing in a diversified basket of securities has been a great strategy over time.
Excel Stock History
Excel makes doing this analysis very easy – using the StockHistory Function and can empower your analysis. Here’s an example.
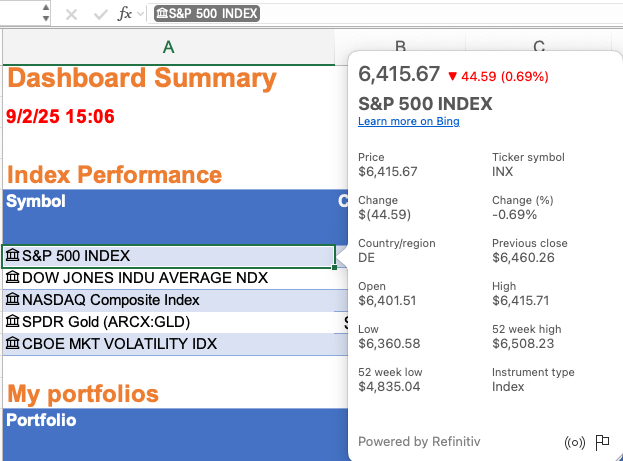
Simply type a stock name or symbol into a cell (in this case in H3). The click on that cell and go to the Data option in the menu and tell it this is a stock:

That then provides a lot of smart options – such as easy access to 52 week high, low, market capitalization etc. See the popup below:
From there – this formula pulls all month end data and places the result on your spreadsheet. This is the formula:
=STOCKHISTORY(H3,”1/1/20″,”8/31/25″,2,2,0,1)
Check Excel help for specific tips. You can pull daily, weekly or monthly data sets. Its fast and reliable.
There’s no better way to test your theories of the market than from the safety of your own home!
I’m tempted to model out alternative trading strategies – such as buying or selling relative to moving averages. However I’m struck how simple and effective the strategy of automating investments for the long term is.
We have seen papers on the importance of starting 401k’s as soon as possible in your career. Using these tools, you can model this for yourself and see how well this option plays over time.
Full disclosure, this is not investment advice and past performance may not predict the future. This post is focused on the importance of long term, rational decision making and highlighting some tools that can help with that!
Enjoy! What tools do you use to help you with investment decisions?
