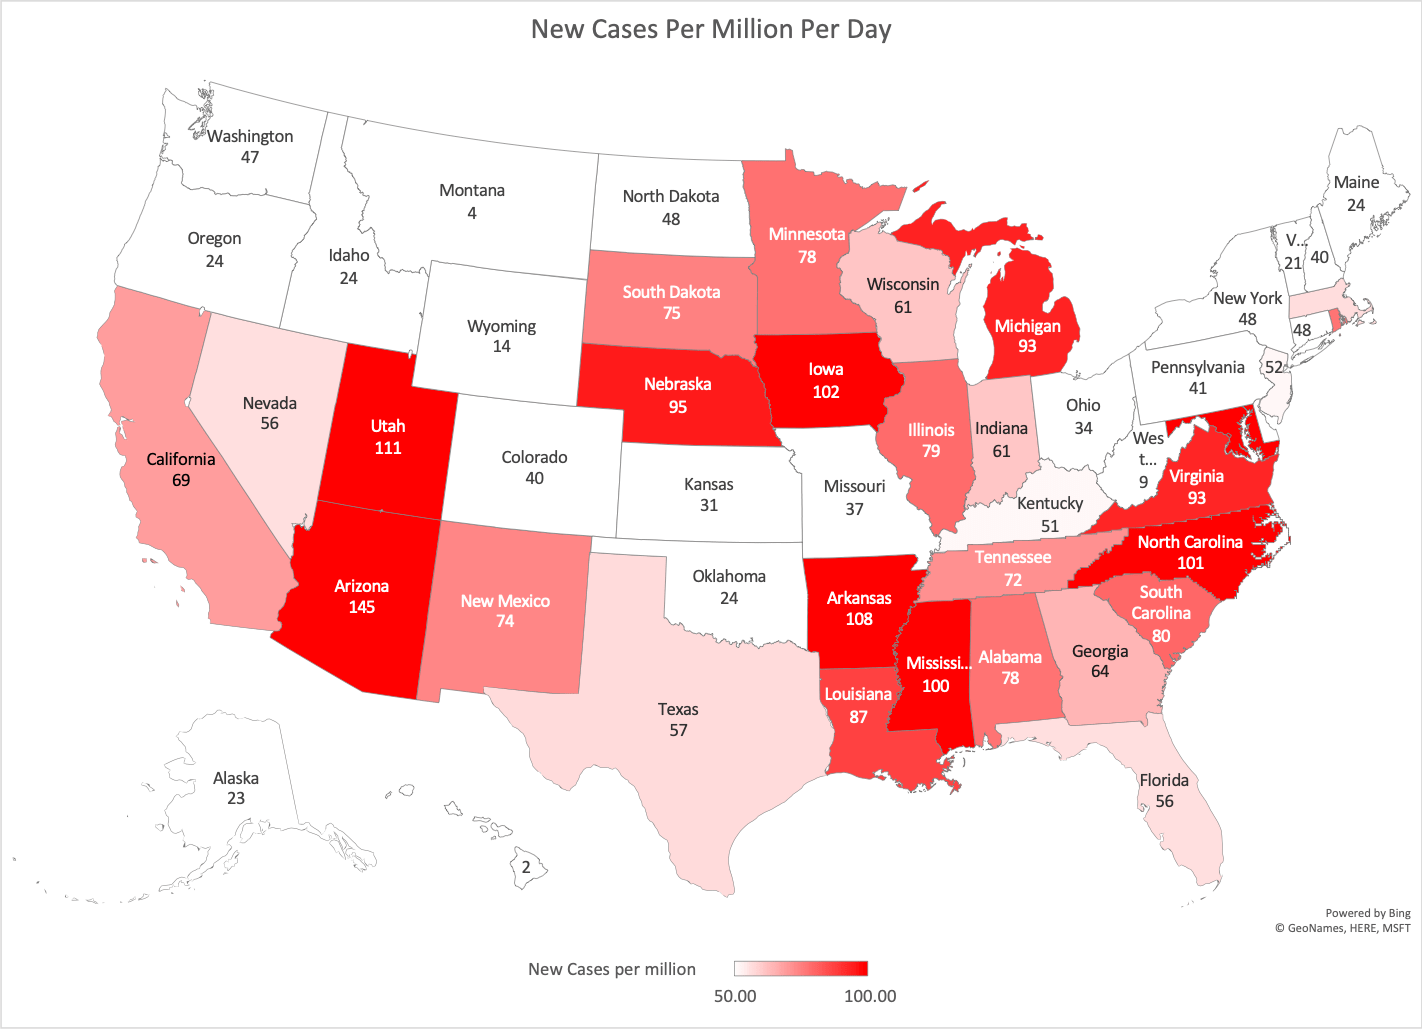
Here’s the latest data showing the rate of new case creation in the US today by state. The good news – NY is less than half the level of some of the worst states for current case creation.
The US total is currently 64 new cases per day, per million people. Fatalities are 2.6 per million people. The US number of cases per million per day peaked in early April at 96 – so we are 33% less than that – however the progress has stalled. The analysis below – shows those states preventing the US average new cases figure from falling further.

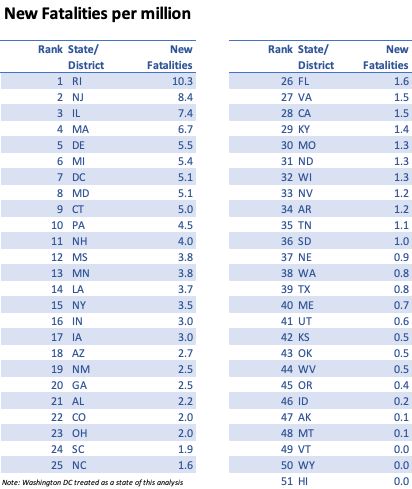
Lets see how this is impacting fatalities:

Rhode Island leads the way in fatalities per million per day – at over 10. Unfortunately it’s too small to see in this US map – so here’s the data in a table. As I’ve posted on my blog – my view of acceptable risk is 1 fatality per million per day; 3 is on the path to acceptable and anything above 5 is far from acceptable.
Here’s a look at my assessment of the US by state – with a focus on the current worst 20 in terms of current 7 day average fatalities per million.
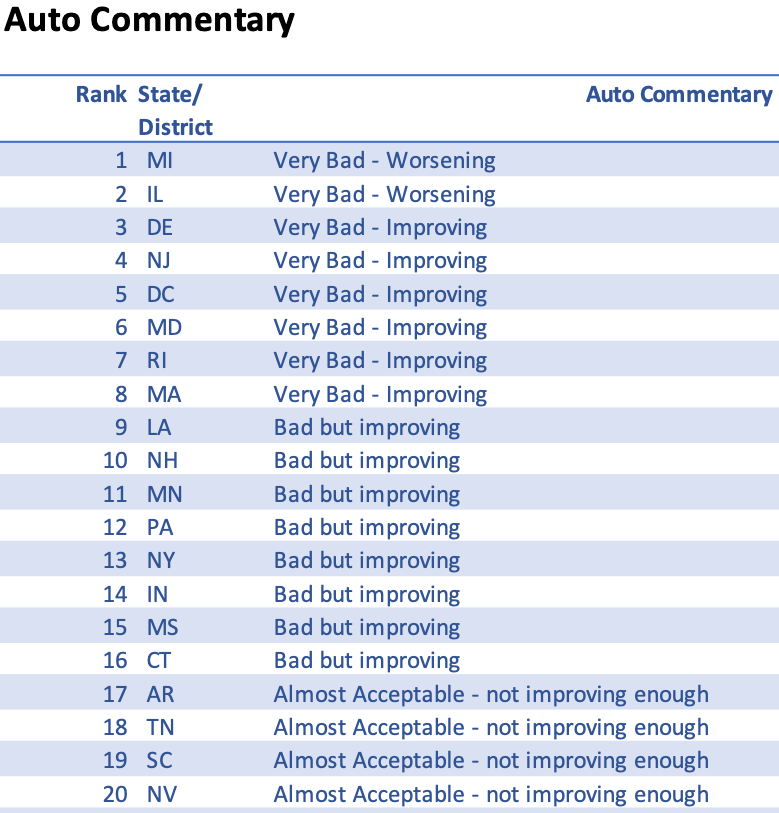
Although Rhode Island is the worst – it’s actually improved week over week both in terms of daily fatalities and rate of new case creation.
Illinois has improved on the rate of new case creation – but its fatality rate is proving to be very stubborn and not coming down at all. In fact, recently the opposite has occured – fatalities have jumped.

Great analysis and statistical work Julian. Glad to see TN down the list on the almost acceptable list for new cases and among the very lowest for deaths per million.
LikeLike