OK folks its Friday – so it’s time for a quick tour around the globe and across the US to see what the COVID numbers are. The mainstream media tends to gloss over some of these facts – so hopefully you’ll enjoy some of these stats.
Global View: Many countries now exceeding the US in new cases
This league table of new cases per million per day is telling:

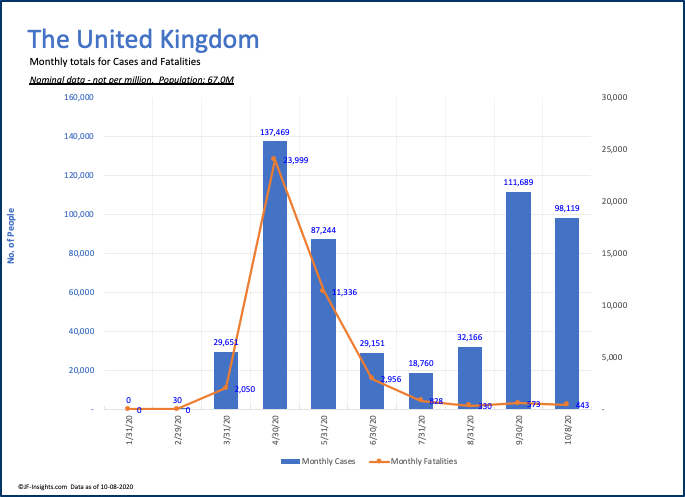
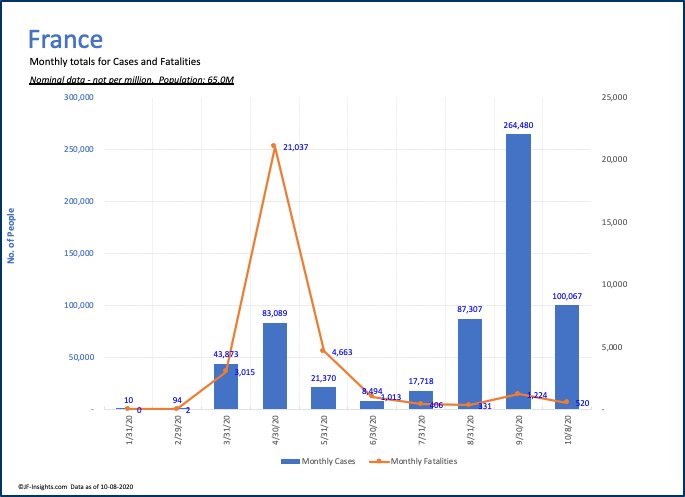
Most of the countries on the top of the list have very small populations (Israel is approx 9 million) – but at #10 we start to see some higher population countries (France: 65 million; UK 67m; Spain 47m).
Cases in Europe have accelerated very quickly. Both UK and France have similar rules limiting gatherings to no more than 6 people.
Check out the chart – in the month of September the UK had more cases than the prior 3 months combines. October is well on pace to exceed September – and likely a new record – exceeding April.
Same story plays out in France – but even more extreme. More cases in September alone than since the begining of the crisis.
Global fatalities since inception – per capita

Lets compare the record of the US with other countries since inception.
While the US has the most deaths in total (210,000) – expressed per capita – the US is number 8 in the word.
I find it very surprising just how many countries are in the range of 500 – 700 deaths per million. Surely there have been different approaches to lockdown and yet at this point results are very similar.
US – slow progress in the aggregate…. but signs that many states are losing control of the situation
Lets take a look at the US. Much as the main stream media likes to reinforce a negative view of our progress – the data shows that overall we are making slow progress.

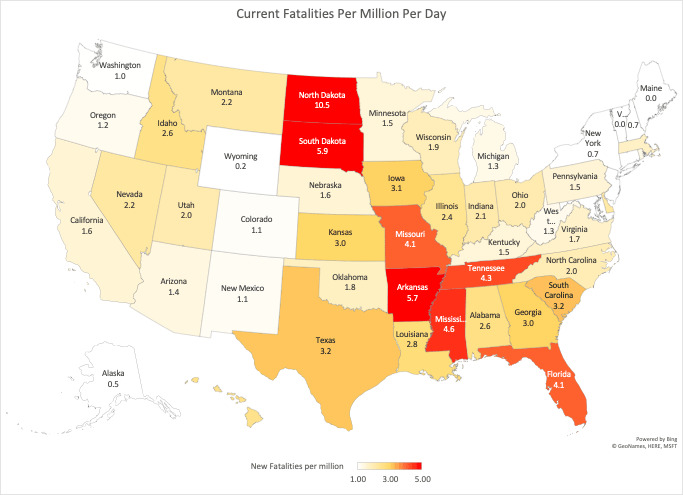
Now I’ll be the first to say – there is ZERO cause for complacency. In fact many states are TOO complacent. Check out the map of the US below – and you can see a diagonal band of states with case levels far too high. North Dakota for example would be a world leader if it were a standalone country. Not good.

As I updated last time – the high cases lead to high deaths – see the current death rates below. The diagonal band is much easier to see in this picture.
Wisconsin
Lets take a deep dive into one county in Wisconsin – Winnebago. This has a population of 171,000 – a reasonable size.
Winnebago has over 1,100 cases per million per day. That’s astronomically high – when the US average is 130. Almost 9x the national average.
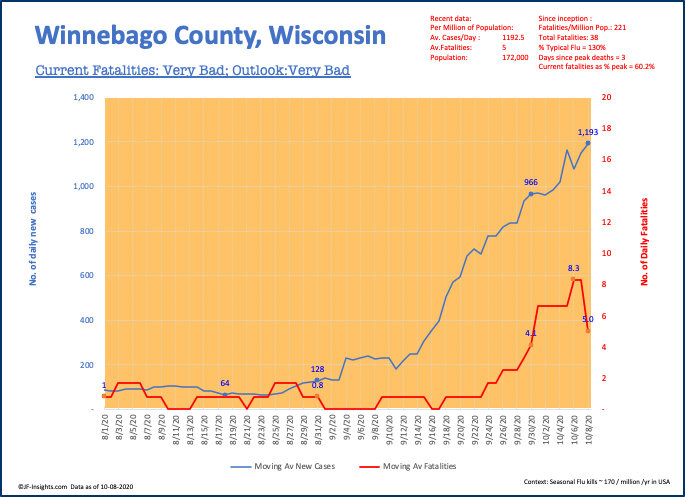
Not surprisingly that’s started to result in deaths in that county. In October to date, twice as many people have died as the average of May thru August.

Conclusion
COVID is demonstrating that it’s a virus that has more patience than most of us do. Every country across the world that lets its guard down for even a month seems to witness an explosive upsurge in cases.
We need to learn the lesson very quickly that we need to control this – and not relax our guard until we really have widespread vaccination for our most vulnerable citizens. Sadly it looks as though COVID is here to stay for a while yet.
