
Short answer – South America, UK and Sweden. US not quite out of the woods yet but the wide divergence in case load by state means that #onesizedoesnotfitall.
What’s the best way to represent the COVID risk we face today. While there is regular reporting of total COVID cases, and total COVID fatalities, at this point this data is backward looking.
We need to look at how many cases are being created today, and the best way to do that in a way that supports an even comparison across countries of different sizes is to do this in ‘per million’ of residents. The results show that South America is rapidly accelerating in its COVID burden.

New cases today are likely to result in future fatalities. How many depends on the capacity of the health care systems of the respective countries to take care of the sick. Once the health care system becomes overwhelmed the fatality rate increases.
The much higher rate of case creation particularly in Peru, Brazil, Chile will shift the global league tables several weeks from now.
The next table shows the current rate of fatalities per million – showing the top 20 countries in my dataset
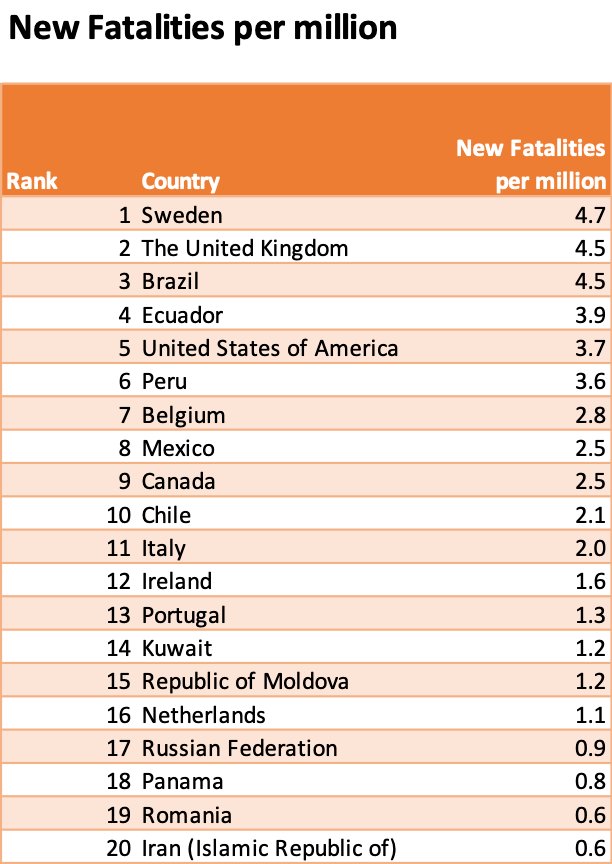
Sweden and the UK both lead the league table for the number of daily fatalities per million of population. These countries were also the early proponents of the herd immunity theory. Several months later the data shows that the fatality rates in these countries have failed to come down as much as those in Spain, France and Germany etc.
Re the US – although the US is not low on this league table – the US did not experience the peak wave of fatalities that most European countries faced (to be covered in another post).
