
Its nice to think about pleasant surprises – and one that does that to me is to think about India’s COVID performance. For a country of 1.3 billion people (about 4x the size of the US), and one with per capita income of $2,000 (yes two thousand – compared to the US per capital income of $60,000) – its ability to keep the lid on COVID is nothing short of remarkable and impressive.
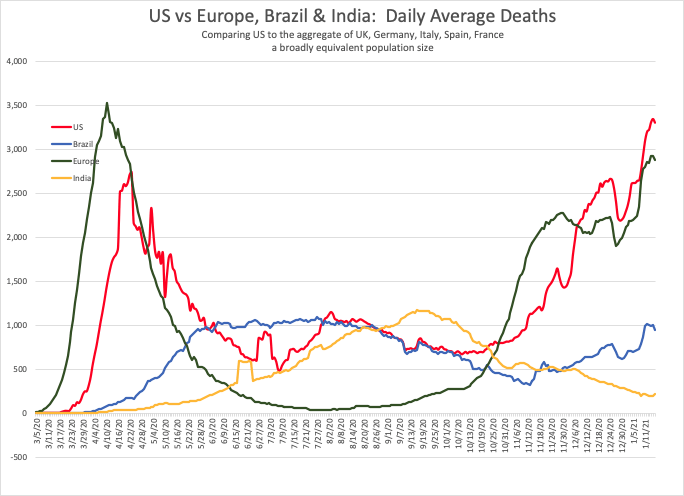
The chart below isn’t adjusted for per capita (if it was India would seem even better) – but the countries I selected in Europe equate to roughly the population of the US. Brazil has a population of 250m.
Around mid September, India’s average daily death toll peaked at 1200 deaths per day. At that point it was higher than all of the regions on this chart.
But since then, the average daily death rate has fallen to approximately 200 (again on a population of 1.3bn people). That’s amazing. In contrast, today the US has an average of over 3,000 deaths per day.
This chart demonstrates the monthly performance of India – peaking in September for cases and deaths.

How did India Beat Covid?
See this article from the Washington Post – How a packed slum in India beat covid. Some takeaways
- Focusing on the 5 areas reporting most cases
- Screening every house for residents with elevated temperatures or low oxygen levels
- Used local doctors to inspire confidence among residents
- Within 10 days 47,000 people were screened;
- 400 symptomatic people tested and placed in institutional quarantine along with 4,000 close contacts
- Government provided protective equipment
- Government lock down
- Delivering ration kits to households without food
“we chased the virus instead of people waiting to report it
Dighavkar – assistant municipal commissioner
Here’s a nice timeline courtsey of the Hindustan Times

Here’s a link for those interested:
Conclusion
India shows that a proactive approach to TEST, TRACE, and ISOLATE really pays off in some of the highest density, poorest places on earth.
