Things may be looking up for now. Seems that the US current levels of new cases at 358 per million per day are about 63% of the recent peak of 569 per million per day earlier this month.
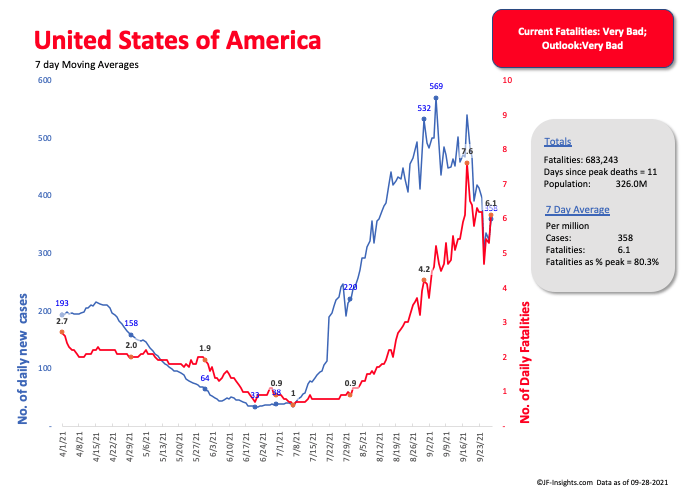
Its too early to call success on fatalities however. Below is the same chart – but with whole numbers – rather than per million figures. Close to an average of 2,000 deaths per day – having been as low as 195 on 8th July.

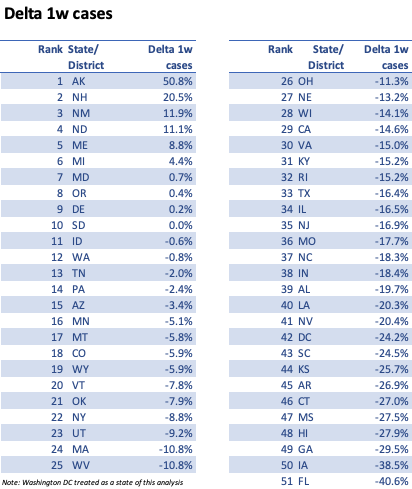
Case numbers are falling significantly in Florida, Georgia, Texas – take a look at the right hand side of this table showing the change in the average daily number of cases week over week.
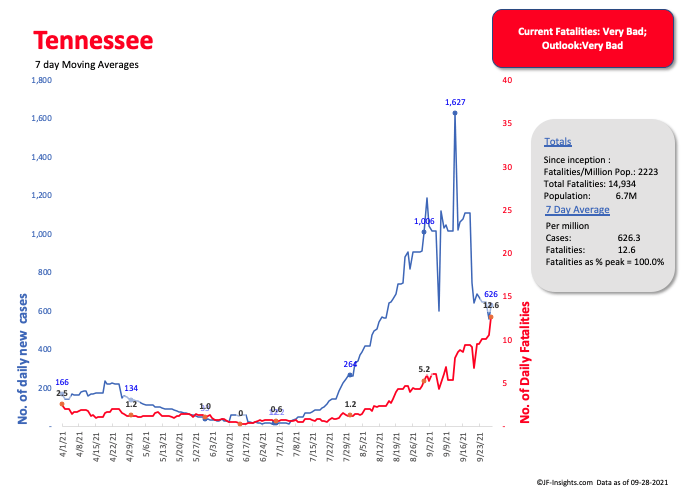
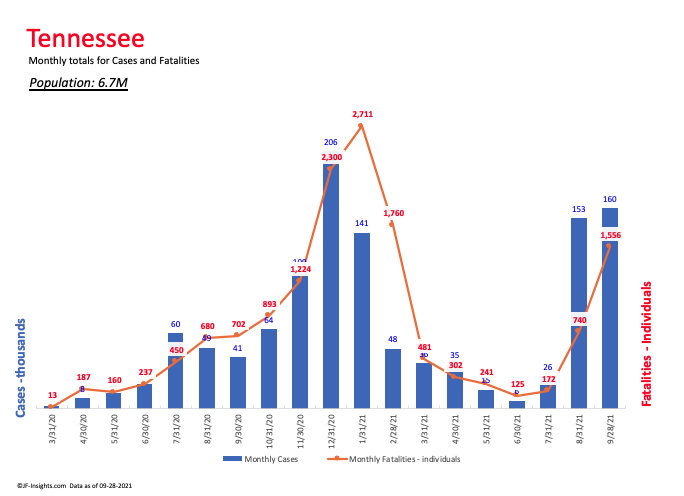
Tennessee looks to have broken the curve… from country number 1 in late August. However over 600 cases per million per day is no cause for celebration. Fatalities are way too high.
Applying that to the rest of the US, generally more than 300 new cases per million per day is still very bad:
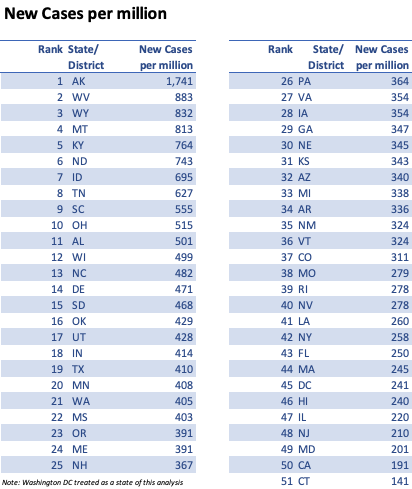
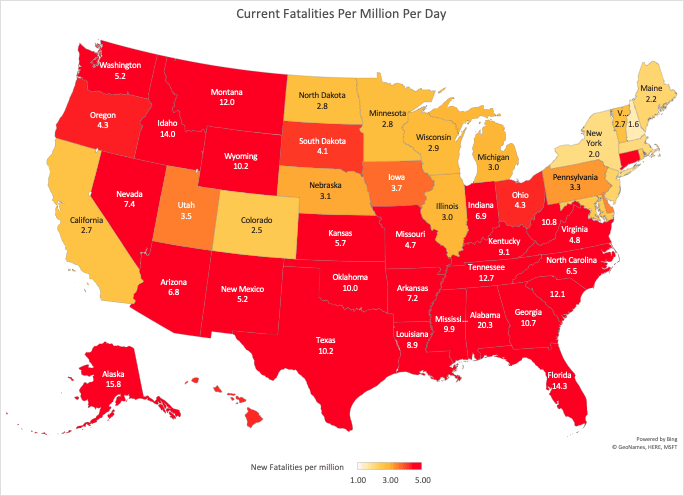
Here’s the same data visually. Tennessee still wants to feature in the league tables

Most states are struggling with very high fatality rates right now. As an example TN has just 6% ICU capacity – just 127 available beds for a population of 7 million:
TN has recorded over 1,500 deaths from COVID this month alone, the 4th highest in this states pandemic history:
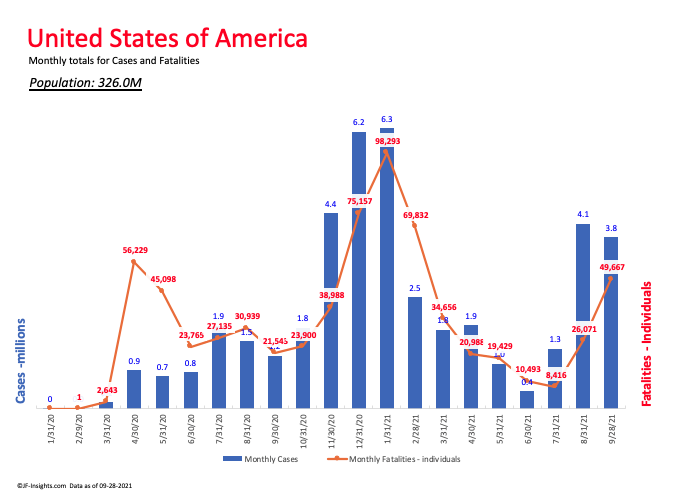
September to date is the 3rd deadliest month in our COVID record:
Close to 50,000 deaths. US deaths from this pandemic at over 680,000 have now eclipsed that of the 1918 flu pandemic (known as Spanish Flu) – albeit the 1918 population was obviously a lot smaller.