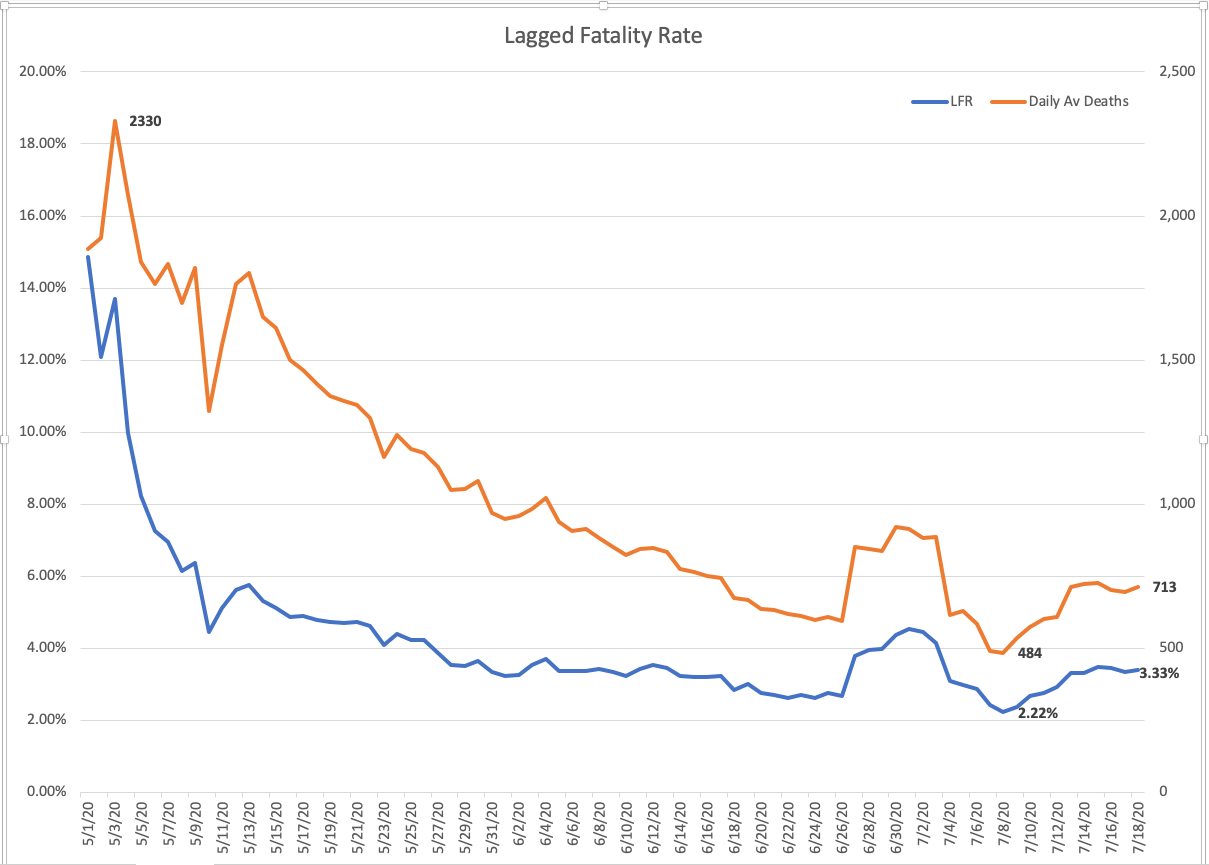
It’s been reported by various sources that the fatality rate is falling. I wanted to ‘trust but verify’ that view. Turns out – it is NOT true. Current US fatality rate is about 3.2% of those tested positive. That’s no different from June data. It’s better than May (about 5.98% average). Since around July 8th – both the number of deaths – and the percentage fatality rate has been increasing.
This chart shows the lagged fatality rate. Basically – fatalities today – are best compared with cases 1 month ago. Lets explain that a bit. On July 18th, the 7 day average of daily deaths was 713 people. Clearly those people didn’t all get COVID on July 17th and pass away 1 day later. It’s reasonable to assume they contracted COVID earlier – so I assume 1 month earlier. Don’t let people tell you the fatality rate is now 1%. It’s not! It’s only that low because the US is recorded record high new COVID cases. The full mortality effect of the new cases reported yesterday won’t be know for at least 1 month from now.

Ignore the spike for the week around June 26th – this is when NJ made some adjustments to their statistics. But take a look at the trend from around end of May.
The fatality rate trend has been very stable and mostly in the range of 2.2% to 3.2% thru May – July
The data does not support significantly lower mortality yet.
In my view – the reason is likely that the virus is still about as lethal as before is because it is still able to find those individuals who are extremely vulnerable to the disease. With the population of new cases, and those contagious, exploding through the roof – the potential for the virus to reach the most vulnerable is vastly increased. The US has a large population of people over the age of 65 (at least 50 million) – and likely a very large population of people younger than 65 but with chronic conditions.
More reasons for caution
The situation in your own state or county could be very different. Take Arizona for example – the lagged fatality rate over the month of July – is currently 4.5% – so that’s over 50% bigger than the national average.
This does not surprise me at all as many of the Arizona cases have been recorded in areas with high poverty. Analyzing Arizona – Poverty may be the key and Arizona hospitals are at capacity.
Tennessee currently has a lagged fatality rate averge for July of 2.22% so a little better than the national average. But equally so, the Tennessee spike in cases has not yet worked its way through the COVID cycle.
Without doubt Tennessee will record more cases in July than all of the preceeding months of the year combined.
Tennesse has recorded 33,365 new COVID cases in the month of July to date – compared to 42,814 in all of the preceeding months this year combined. The 7 day average of new cases is over 2,000 per day (and 12 days to go).
The level of case creation in July has obviously not yet worked its way through the hospital system. Expect a big jump in demand for hospital beds in Tennessee over the next month.
There’s no silver bullet to this virus yet.
Fatality rates today are little different from when I last reported on them.
I’ll check back on this again in about 1 month. Until then be careful out there

Ty
LikeLike