Here’s a quick roundup of the COVID data for the week ending August 13th. Sunbelt still has much work to do. Georgia shows how not to reopen schools.
New Cases
- The US has now recorded over 5.1 million COVID cases and is currently averaging 52,000 new cases per day. Only India (population 1.3bn) is currently recording more per day at 61,000 per day. The rate of improvement in cases and fatalities has stopped.
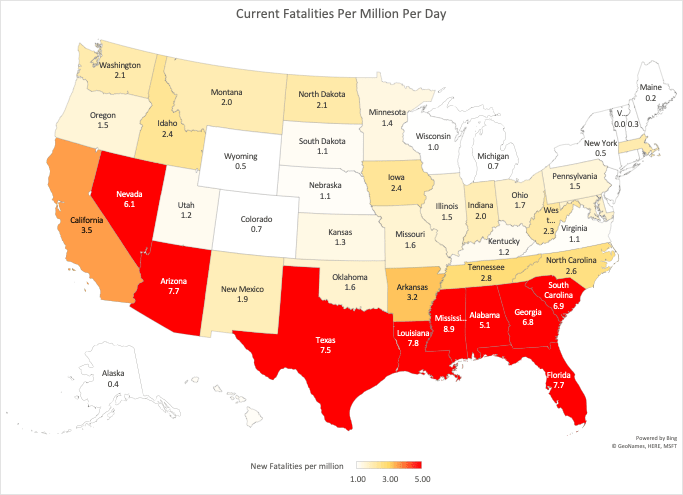
- Georgia has highest rate of new case development in the US with 311 new cases per million of population per day. It is also #7 on the list of states for most fatalities per day at 6.8 deaths per million per day
- Florida is #2 for new case creation with 308 new cases per day (per million); and #4 on the list of fatalities at 7.7 per milion per day.
- California is recording the most new cases at about 9,000 per day – but bear in mind it’s population is 40 million people. That puts California at # 11 on the list per capita – at 225 per million per day.
- Tennessee is #6 on the list at 254 per million per day
- Check out the North East states all are less than 100 per day; NY, NJ etc are below 50.

Fatalities
- The #1 state for fatalities per day is Mississippi at 8.9. A number of other states have reached this point and from their precedent, it takes quite a while to come down once this level is reached
- #2 is Louisiana with 7.8 fatalities per million per day. Check out the chart below. In my mind Louisiana is the state that never really declared victory on COVID. To have one of the highest fatality rates in April, and again in August is a travesty. Since inception Louisiana has 940 fatalities per million – putting it #6 in the country. That just shouldn’t happen in a state with low population density. Only the states with much higher population density are higher on the list (Louisiana has 1/10th the population density of New Jersey!).
- #3 is Arizona with 7.7 fatalities per million per day. Fatalities in the state peaked on July 17th at around 11.7 fatalities per million per day. From the chart below you can see the path to reducing fatalities is slow. The COVID health outcomes in this state are currently the worst in the nation. The lagged fatality rate for recent cases is about 5%.
- The fatality heat map shows that the worst fatality rates currently are fully concentrated in the South – with very likely hospital strain in these states. This must surely be a factor for school reopening in those states.
Some charts

New case heat map – The North East and Wyoming doing well! 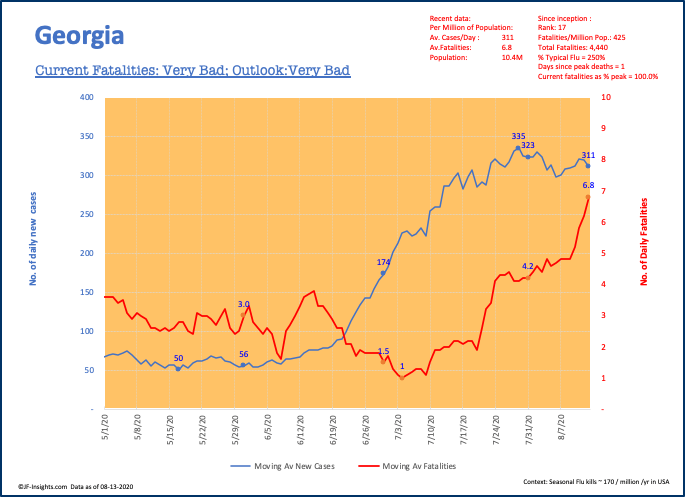
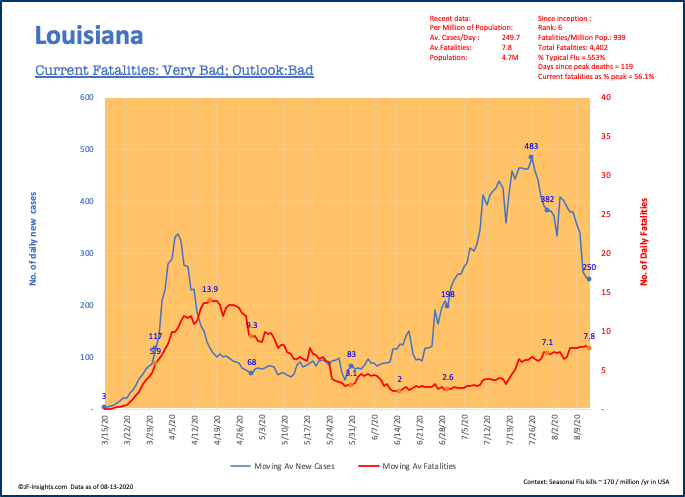
Louisiana cases are higher than after Mardi Gras; fatalities on the rise 
Arizona: Great progress on cases; fatalities falling slowly 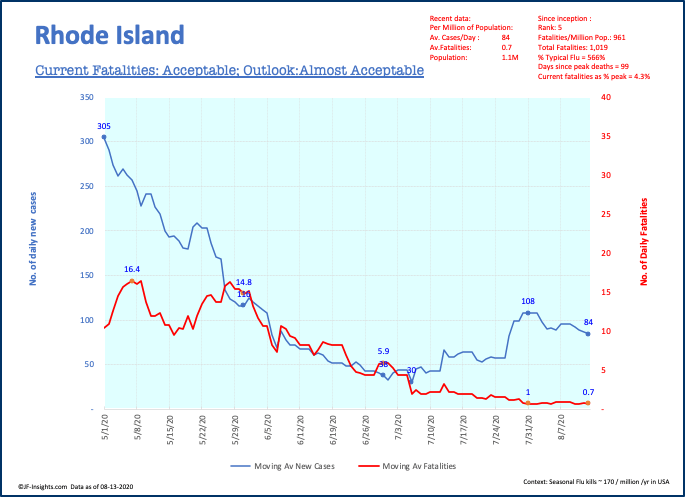
Rhode Island shows that fatality rates come down very slowly 
The US caseload and contagious numbers are still too high 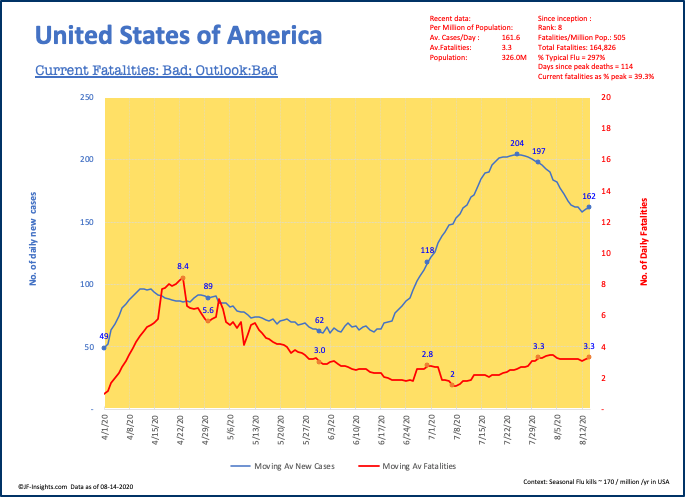
Going into the school reopening period cases are potentially nuding up; fatalities flatlined
Back to school?
We’ll look back on these statistics as school reopenings gather pace across the nation. Anecdotally its noted that Georgia has already reopened schools and closed down some very quickly in Cherokee County. Lets take quick look at those charts for this county.

Rapidly increasing cases and fatalities 
Rapidly increasing contagious population
As you can see from the left hand chart, daily new case are up 67% from the end of July.
The right hand chart shows the number of people contagious (those diagnosed in the last 2 weeks) and those still suffering (diagnosed in the last 30 days). Both of these charts are up dramatically.
There are about 10x as many people contagious in Cherokee County today as there were in mid June. That’s clearly not good.
We are watching this space very carefully! Lets hope Cherokee county is NOT a model for the rest of the US regarding school reopening.

Thank you Julian!
LikeLike
Thanks Burton! Hope you are well !
LikeLike